

MarketView Desktop 6.27
Changes in version 6.27
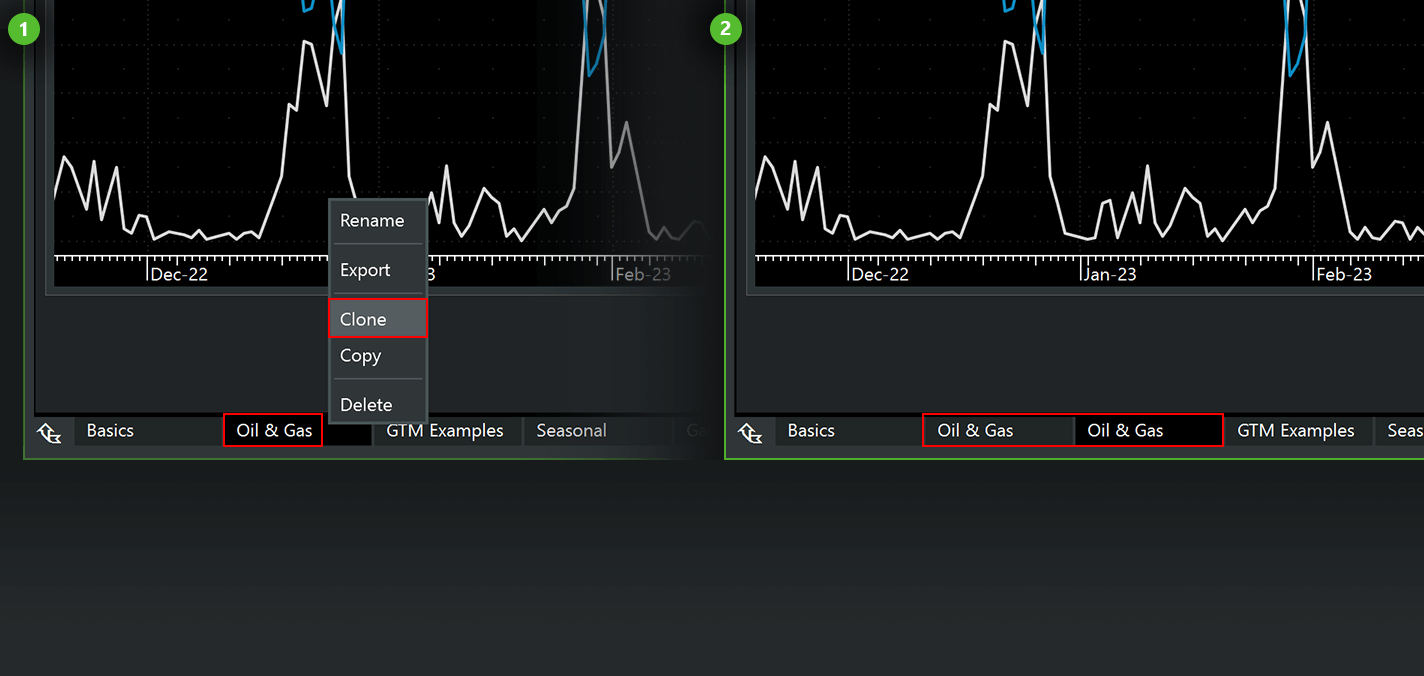
Copy/Paste and cloning of workspace tabs( 1 of 2)
You will now be able to duplicate a workspace tab within the same workspace.
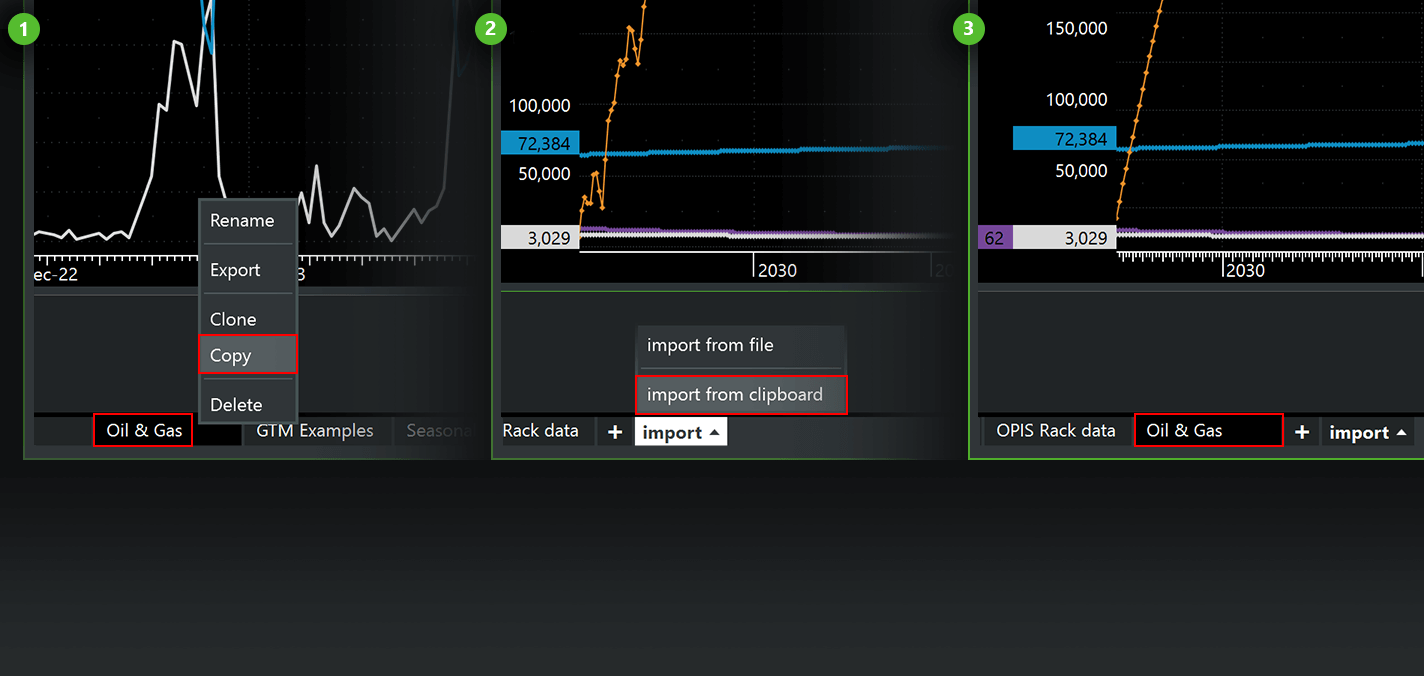
Copy/Paste and cloning of workspace tabs( 2 of 2)
You will now also able to copy a workspace tab from one workspace to another:
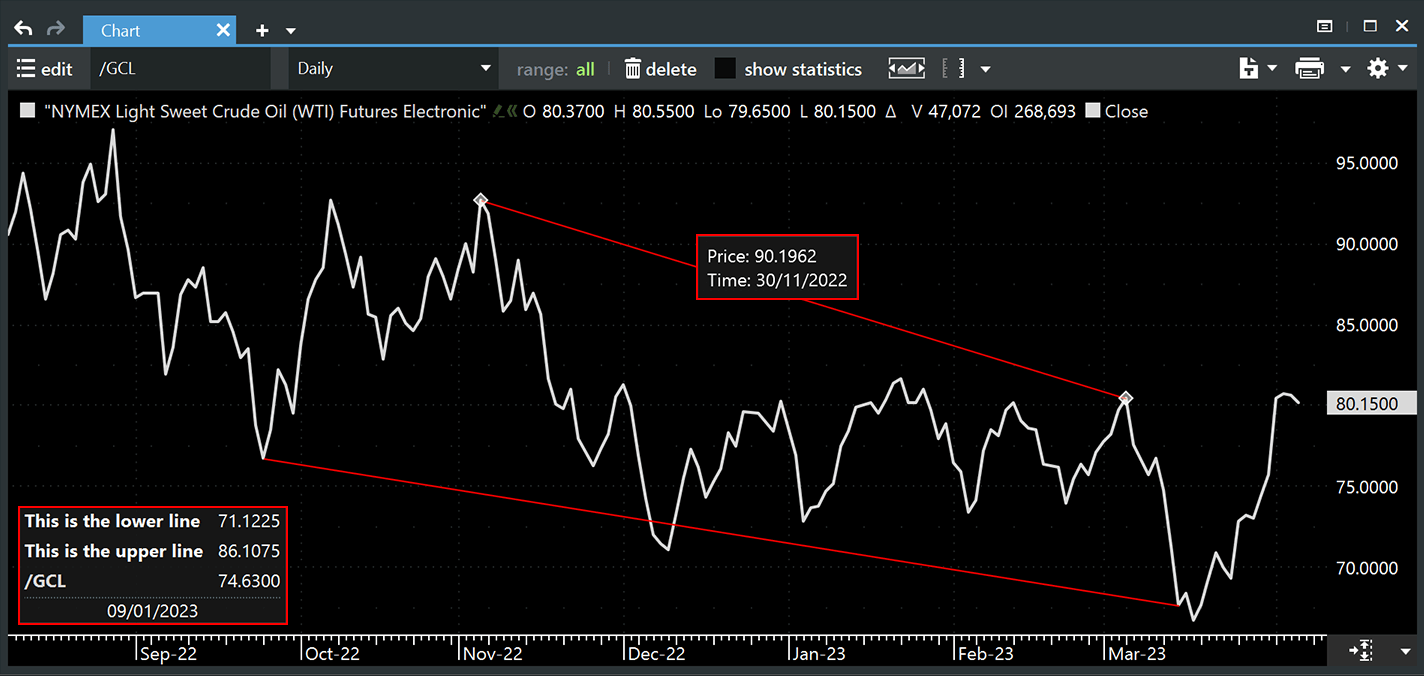
Improved line annotations for chart and curve windows( 1 of 3)
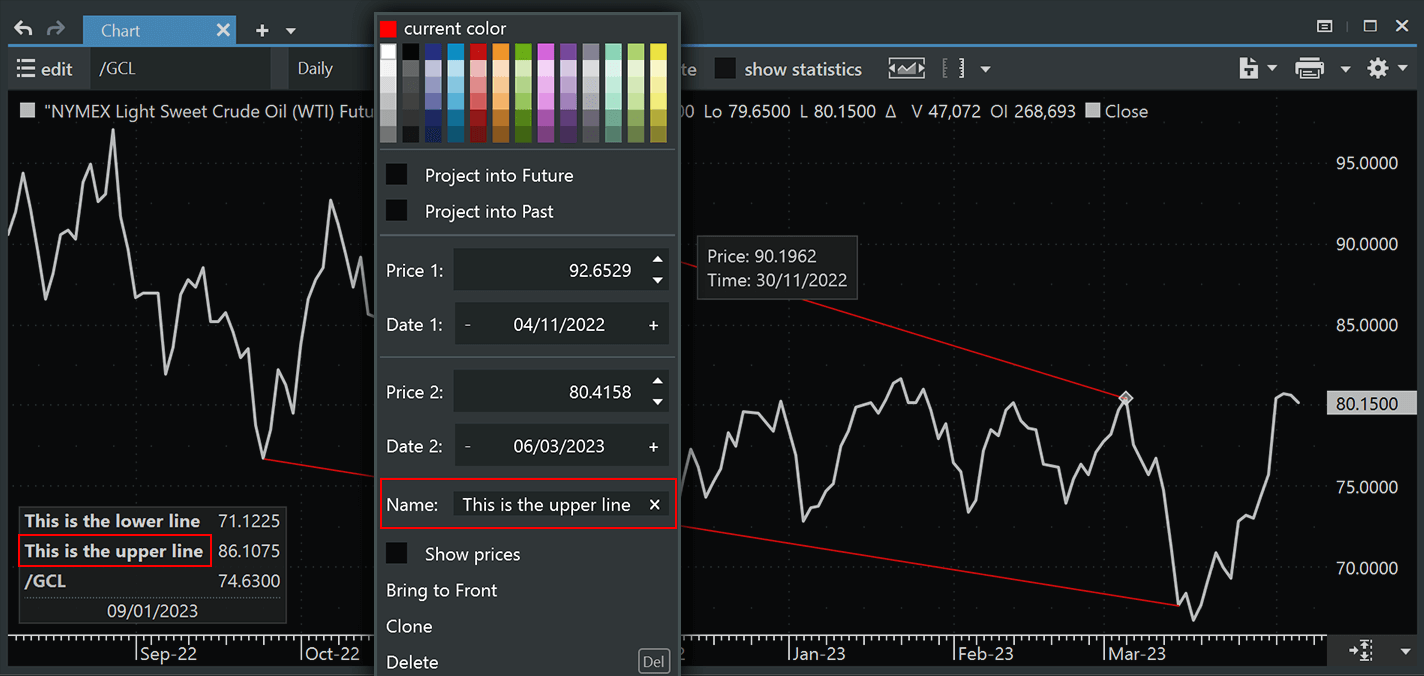
You will now be able to see the exact price/date value of a trendline that you had drawn, either in the mouseover box or in the data info panel in the bottom left corner of the window.
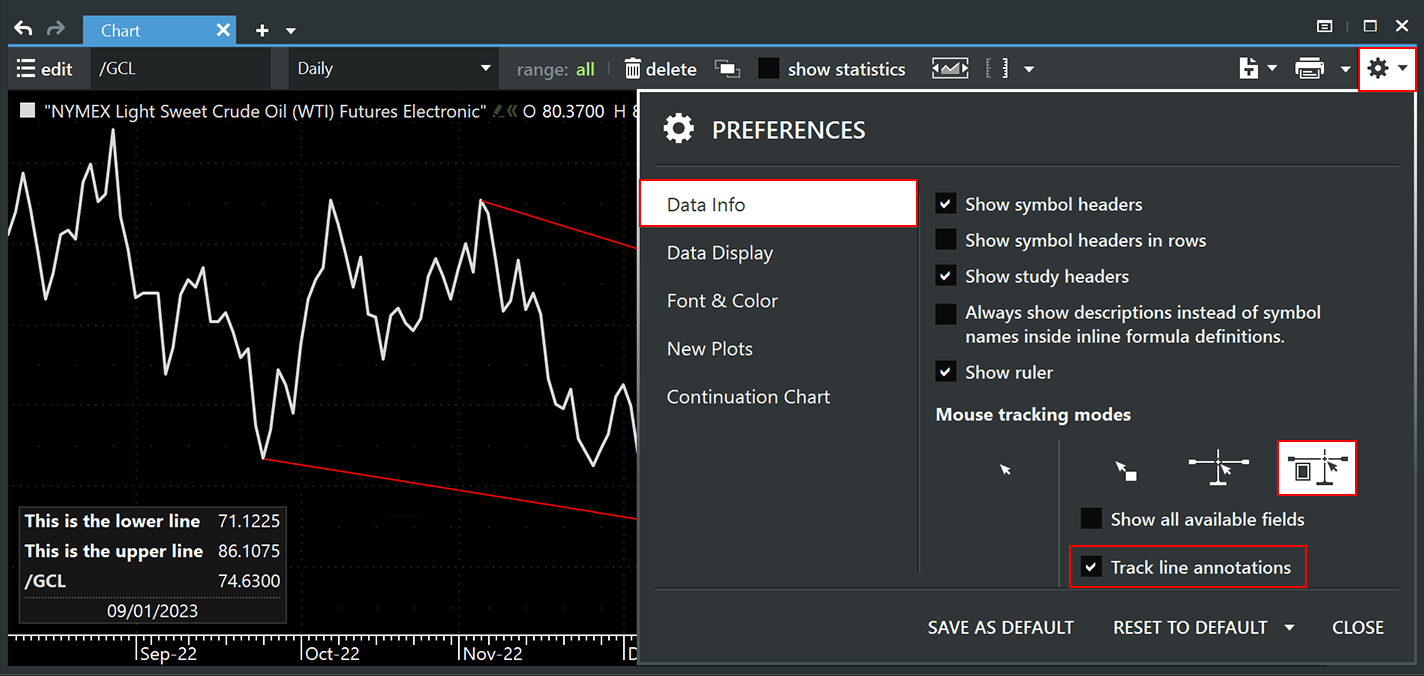
Improved line annotations for chart and curve windows( 2 of 3)
This can be enabled in the preference menu of the window.
Improved line annotations for chart and curve windows( 3 of 3)
You can now also give those trendlines a name, which can be done in the context menu of each line.
Default values for Fibonacci, Speed Arc and Pitchfork annotations
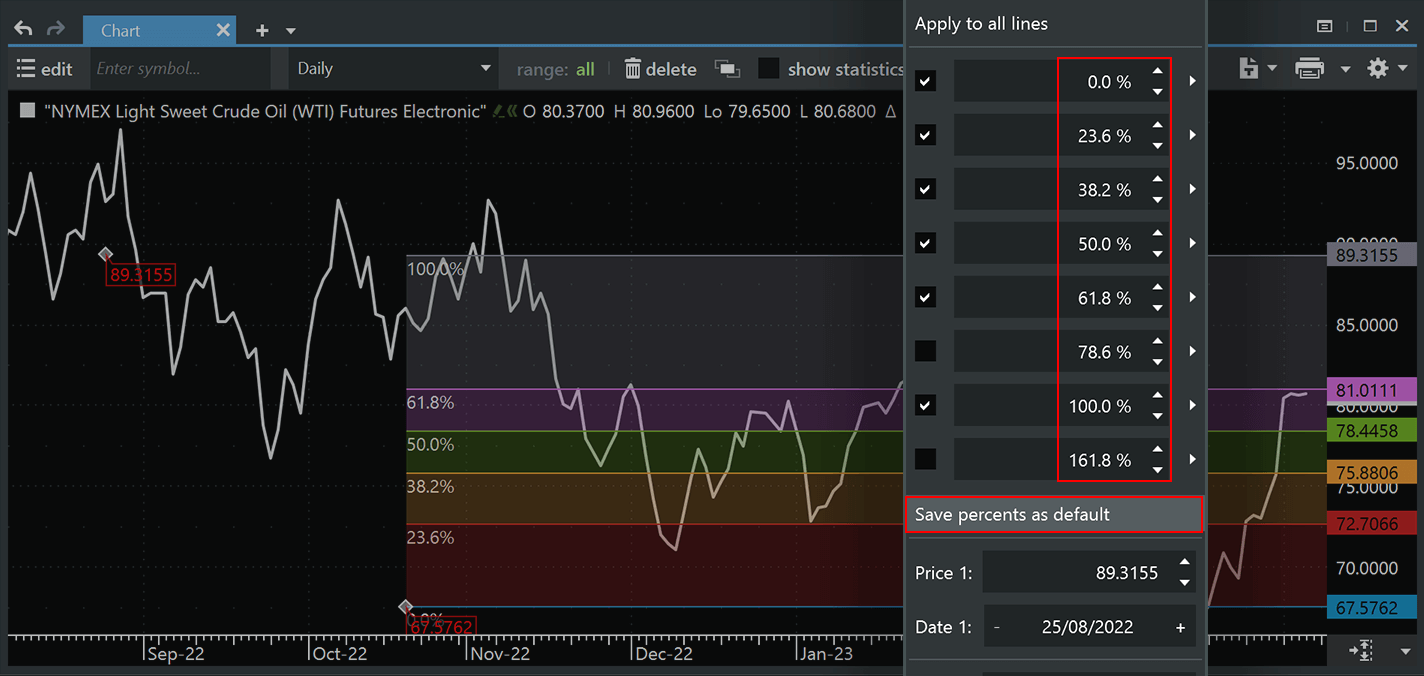
You will now be able to save default values in the context menu of each annotation.
The following annotations support this new feature:
• Fibonacci Projection
• Fibonacci Retracement
• Fibonacci Arc
• Fibonacci Fan
• Speed Arc
• Andrew’s Pitchfork
• Schiff’s Pitchfork
• Modified Schiff’s Pitchfork
Bug fixes
General: We improved logging for the symbol tree functionality in the Edit window to better track problems with the display of the symbol tree.
General: Our release notes pop-up window was showing incorrect release notes if the user would upgrade from a much older version than the current one.
General: The symbol tree in the Edit window would not load correctly and would just show a spinning circle under certain circumstances.
General: A crash occurred if the symbol tree contains duplicate folders and if one of those folders was opened in a specific way.
History: If the “Data Fill” options were used for a symbol with a lot of empty rows, then not all of those rows got filled.
Chart: The Y axis of the frequency chart displayed wrong values for symbols that have large prices.
Chart: The values in the Statistics panel on top did not display correctly if a large font size was selected.
Chart: The header display options were not working correctly for the Frequency Chart.
Chart: Using “Project into Future” or “Project into Past” was not working correctly for line annotations if the line was drawn from the right to the left.
Table: In the Edit window, the most recently opened folders in the symbol tree were not correctly saved.