Help Files
History Process
| MarketView > History > History Process |
The MarketView Historical Data interface allows you to create historical data tables with automated data filling methods, and optional unit and currency conversion. MarketView provides historical data going back to the early 1970's for most energy data.

The process of adding a historical table to your MarketView page is simple: specify the desired symbols and select the data fields you want. Once the table is set, new data is automatically updated into your page.
1. Initiate the query by clicking on the history icon.
2. Select symbols to display.
1. If you know the specific symbols, enter them directly.
2. If you don't know the specific symbols, use the Search or Symbol Tree to find them
3. If desired, set currency or unit of measure conversions for symbols.
4. Identify the data fields you wish to display using the field selector.
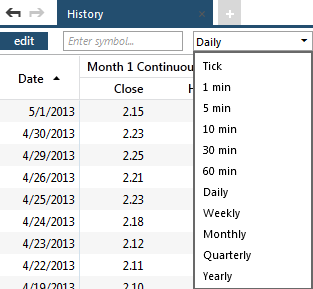
5. Identify the Time Series of data you want displayed (Tick, Intraday, Daily, Weekly, Monthly, Quarterly, Yearly, Seasonal)
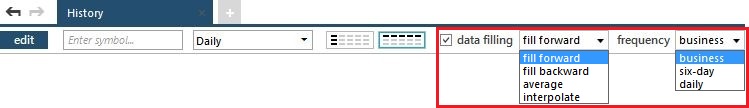
6. Select a data filling option
7. Optionally chose Preferences for the query to edit display settings such as gridlines, colors, and fonts.
8. Pages are automatically saved after each click.