| |
The combo box at the bottom of the dialog is used to set the time frequency and amount of data to extract on the chart.
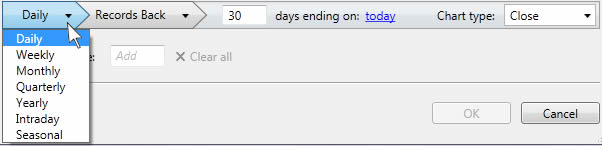
FOR DAILY / WEEKLY / MONTHLY / QUARTERLY / YEARLY QUERIES:
Select either Records Back or Date Range from the drop-down list.
- EXAMPLES for RECORDS BACK:
Daily data for 60 days ending on today

Weekly data for 12 weeks ending on 1/2/2011

Yearly data for 6 years ending on current year

- EXAMPLES for DATE RANGE:
Monthly data from 7/2008 to current month

Quarterly data for the current quarter only

FOR INTRADAY QUERIES:
Enter the number of bars and the minute aggregation.
- EXAMPLES:
50 bars with 15 minute aggregation
120 bars with 30 minute aggregation
FOR SEASONAL QUERIES:
- Enter the time frame (Daily/Weekly/Monthly), a date range, and the year or years. When setting the date range, click on the date to display a calendar (select the day/month from the calendar).
- When entering the year, one, two and four-digit years are acceptable. Enter multiple years separated either by commas, spaces, or semi-colons. (7,08,2009,10 = 2007, 2008, 2009, 2010)
- EXAMPLES:
Daily from 08/01 to 12/31 for years 05 06 07 (extracts 2005, 2006, 2007)

Weekly from April to June for years 2008; 2009

Monthly from June to September for years 0,1,2,3,4,5 (extracts from 2000 - 2005)

Note: Seasonal queries cannot be used with Candlestick or Bar Chart chart types.
|