| |
- Open an Excel spreadsheet.
- From the Data tab, click the Chart icon from the ExcelTools toolbar. (If you have not saved your credentials, you will be asked to log in.)
Result: The Insert Chart dialog box appears.
- Select symbols to appear on the chart. (Multiple symbols can be plotted on one chart.) There are three ways to do this:
- When you know the specific symbology, type directly into the symbol field at the top right of the dialog box, pressing ENTER when done. View detailed information on symbology.
Examples:
- Enter /CLZ11 for December 2011 Light Crude Oil Futures
- Enter /NGS11 for November 2011 Globex Natural Gas Futures
- Enter /CL[0] OR /CL<0> for NYMEX Crude Oil Day session - Front Month (see Rolling Futures Symbology for more information).
- Enter /HO<3> for the (Continuous) 4th Month NYMEX Heating Oil
2. SEARCH: Enter a phrase to search for in the field marked "Search" at the top left of the dialog box. View detailed instructions for using Search.
3. Use the Symbol Tree to navigate through the exchanges and categories to find the desired symbol. View detailed instructions for using the Symbol Tree.
- Select the Chart Time Series along with the number of records back, or a date range.
- Choose the Chart Type.
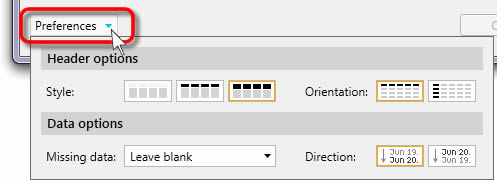
- Optionally choose additional display settings by clicking the Preferences link. View detailed information about the Chart Preferences
- When done, click OK to insert the Chart on your spreadsheet.
|