Help Files
Charts Data Display
| MarketView > Charts > Charts Data Display |
Once you have created a chart you will want to know how to read it and edit some of the characteristics. This section will point out
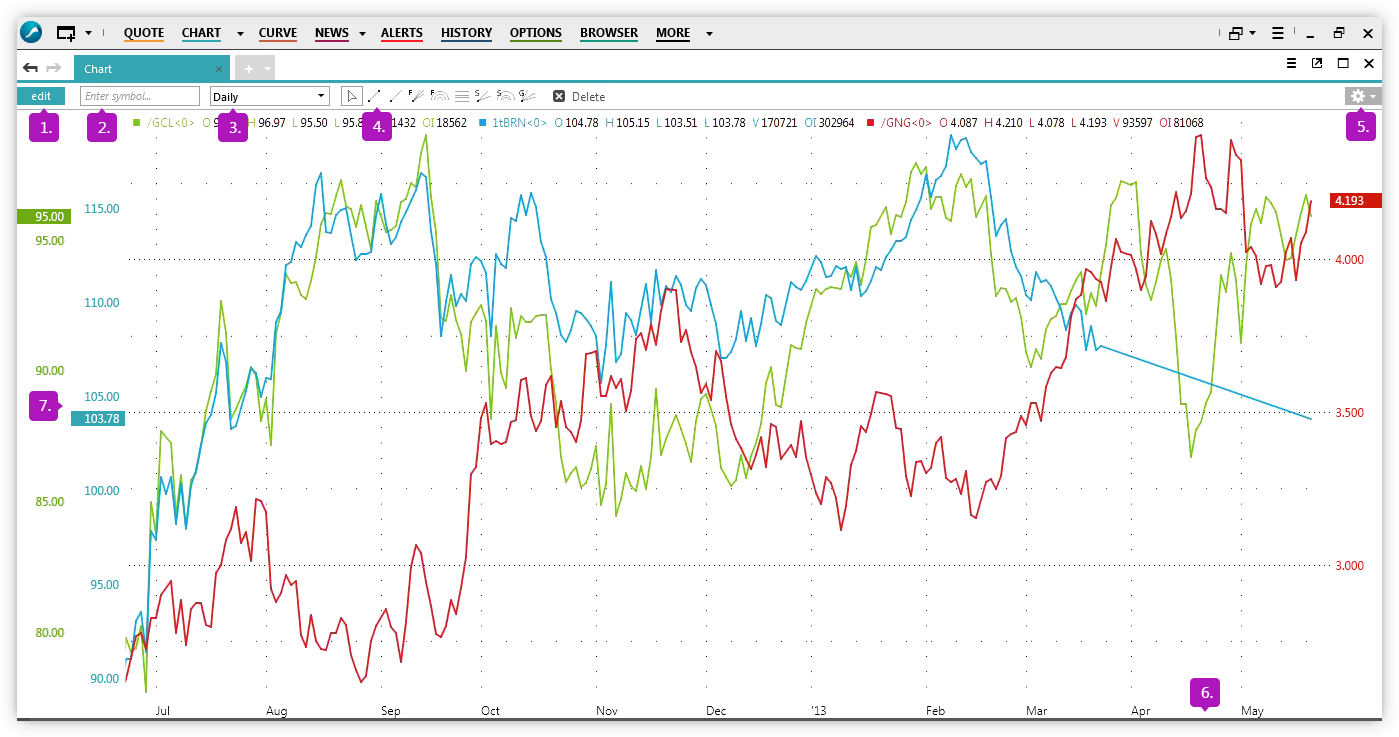
| 1. Edit | Use this button to access the edit chart dialog box. From here you can access the symbol tree, add/remove symbols, add studies and change line color. |
| 2. Enter Symbol | Use this box to add a symbol to the chart. You must know the symbol name, if you dont use the edit button to search for a symbol. |
| 3. Time Series | Use the drop down to select the frequency in which you want to see the data (daily, weekly, monthly, etc...) |
| 4. Drawing Tools | Use the drawing tools to set up trendlines on your chart. |
| 5. Settings | Use the settings icon to change the fonts and colors within your chart. |
| 6. X-Axis | Plots the date of the data. |
| 7. Y-Axis | Plots the value of the data |