Help Files
Chart Types
| Excel Tools > Charts > Chart Types |
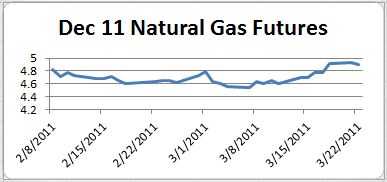
OPEN, HIGH, LOW, CLOSE, MIDPOINT, VOLUME:
Produces a line chart plotting the associated data. For example, if you choose a Chart Type of "Close", the line represents the closing price of the symbol on each point on the time scale.
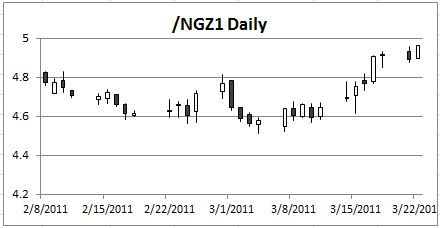
CANDLESTICK:
A Candlestick chart uses the open, high, low, and close of for each point on the time scale. "Hollow" and "filled" candles are formed, depending on whether the close is above or below the open.
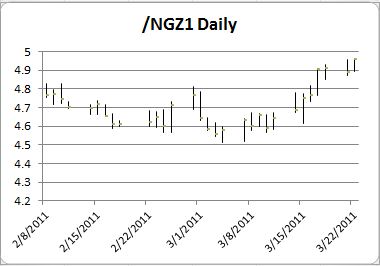
BAR CHART:
A Bar Chart draws a vertical line whose highest and lowest point represents the high and low price for time period. The bar drawn on the right represents the closing price, and the bar drawn on the left represents the opening price.
|