Chart Preferences
When creating a Chart Query, you have the option of setting multiple display settings by clicking the Preferences link found in the lower left corner of the dialog box.
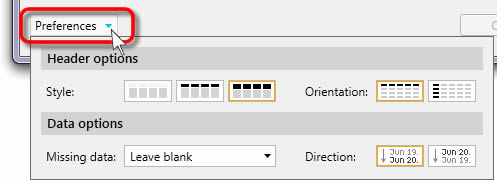
HEADER OPTIONS
Style
The default setting for a chart query will Bold the headers in each column. You may change this by clicking on a Style icon:
 No Headers - no column headings will display No Headers - no column headings will display Normal Headers - normal font weight is used for column headers Normal Headers - normal font weight is used for column headers Bold Headers - bolded font weight is used for column headers (default) Bold Headers - bolded font weight is used for column headers (default)
Orientation
The default setting for a chart query will place the supporting data for each symbol in a row, with each selected data field as a column. You may change this by clicking on an Orientation icons:
 Symbols in Rows - each symbol is placed in a row, with each selected data field in a column (default) Symbols in Rows - each symbol is placed in a row, with each selected data field in a column (default) Symbols in Columns - each data field is placed in a row, and each symbol in a column. Symbols in Columns - each data field is placed in a row, and each symbol in a column.
DATA OPTIONS:
Missing Data - The Missing Data setting determines what data (if any) should be inserted in the spreadsheet when there is no reported data from the exchange for a specific time period. Missing data typically occurs when a holiday falls mid-week.
- Leave blank - Cells will be left blank when no data is present for the time series.
- Use previous - Cells with missing data will be populated with the previous session's closing values. (default)
- Use next - Cells with missing data will be populated with the next session's opening values.
- Interpolate - This option will fill any missing data in a data series by calculating and constructing the data points using the previous and next values in the series. This option will not fill blanks at the beginning or end of the data series.
Direction - The Direction setting identifies how data is sorted on the spreadsheet. The default Direction setting presents the data from Older to Newer.
 Older to newer - shows the Oldest data at the beginning, with Newer data at the end (default) Older to newer - shows the Oldest data at the beginning, with Newer data at the end (default) Newer to older - shows the Newest data at the beginning, with Older data at the end. Newer to older - shows the Newest data at the beginning, with Older data at the end.
|